


Money Money Money
Forest’s promotion to the Premier League has transformed the finances of the club, but the numbers are now so large it can almost feel bewildering, what does any of it actually mean?

Having given a quick response to the latest Nottingham Forest accounts, up to 30 June 2024, on BlueSky I thought I would take a bit of time to break down the numbers and also show where they come from. Forest’s promotion to the Premier League has transformed the finances of the club, as you would expect with all the rhetoric around the “Richest Game in the World” that brought us here, but the numbers are now so large it can almost feel bewildering, what does any of it actually mean and how can we turn statutory accounts into some simple takeaways?
Everyday Income and Costs
There is a term in the accounting world called EBITDA. In long form this stands for Earnings Before Interest, Tax, Depreciation and Amortisation, but the short hand way to think about it is the balance between your normal trading, or everyday, income and costs. It shows you how sustainable your normal activities are, which in the case of a football clubs means can you keep playing matches without too much worry.
Forest’s Income, or Turnover, has increased dramatically since promotion. In the Championship the club raised about £25M per year in income, whereas in the 2023/24 financial year income was £190M, which was itself an increase on the previous year’s total of £155M, and is more than 7 times the size of Championship income. The best place to look into income is in the notes to the account, where Note 3 gives a breakdown of the income received by type, as shown below:
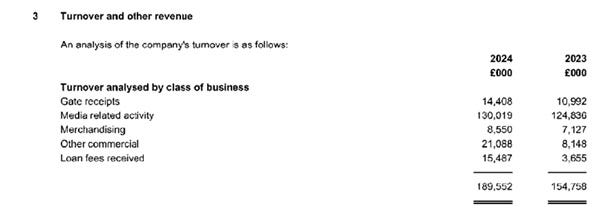
There are 5 categories of income shown and all of them have increased year on year. Gate Receipts are up by £3.4M (31%), Media income by 5.2M (3%), Merchandising £1.4M (20%) and then the big movers Other Commercial £12.9M (159%) and Loan Fees received £11.8M (324%). The increase in commercial income will mostly be down to the addition of a front of shirt sponsor, although as with many things in modern football this feels a little tainted by the investigative journalism of Josimar.
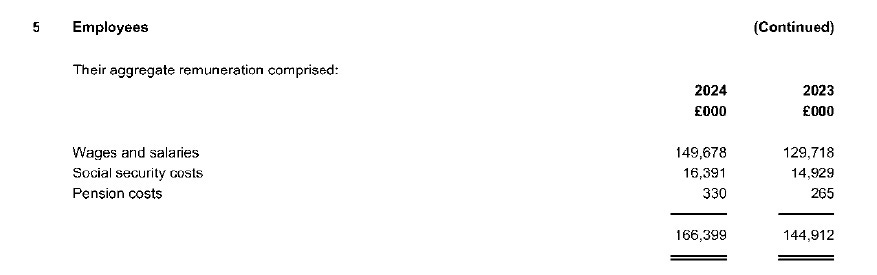
On the cost side we look at staff costs, which have risen from £145M to £166M year on year and represent 88% of turnover. As you would expect this is again a huge increase on the Championship but because wages have grown by a smaller factor than income it has had a positive impact on EBITDA. For non-staff costs we take the Cost of Sales and Administrative Expenses from the Profit and Loss Account and deduct Staff Costs, Amortisation and Depreciation, to come to a figure of £33.6M, an increase of £5.5M year on year.
All of this adds together to create an EBITDA of £(10.4)M, which is negative and therefore means that our day to day income is lower than our running costs, but it is a smaller figure than the club has seen for a long time, as the chart below shows:
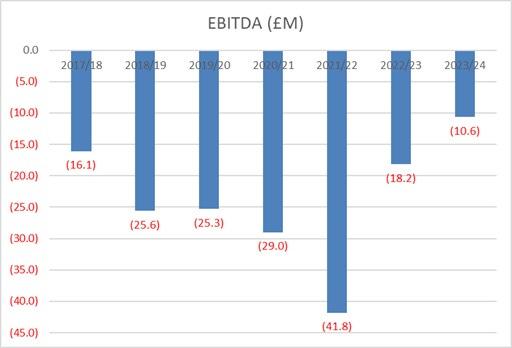
The importance of this negative EBITDA is that it tells us that unless we sell players and make a profit on those dealings we are unsustainable and obviously from that, we also aren’t generating the funds to invest from our normal activities. Transfer activity though is a massive part of the football business, so it makes sense to dig a little deeper into that now.
Transfer Activity
To understand the club’s transfer activity we look at the Intangible Assets section of the Balance Sheet and combine this with the Profit on Disposal of Player Registrations in the Profit and Loss Account.
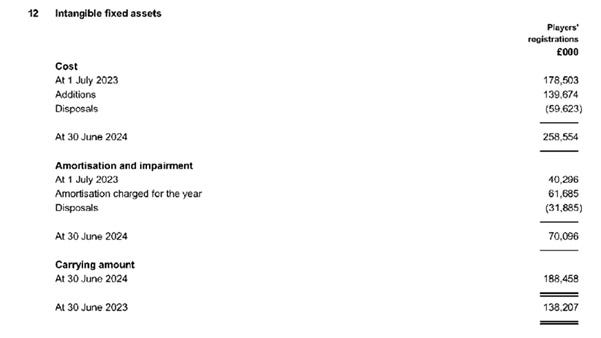
In the first section of Note 12 above we can see that the club started the year with a squad that had cost it £178.5M. During the year they bought new players to add to the squad at a total cost of £139.7M, this included Elanga, Hudson-Odoi, Murillo, Sangare and others, and they sold players who had originally cost £59.6M, including Freuler, Niakhate, Mangala, Vlachodimos and of course Brennan Johnson, although he didn’t cost us anything as he was an Academy Graduate.
Amortisation can be a bit trickier to understand. Every year a charge is made to the accounts for the cost of players bought, but that cost is spread over the length of their contracts, so if a player is signed for £8M on a 4 year contract the Amortisation charge will be £2M per year for 4 years. At the start of the year the club had already charged £40.3M of the cost of its starting squad (that £178.5M mentioned earlier) in previous years.
Of that £40.3M already charged £31.9M (shown as Disposals) related to players who were sold in the year and this is important, because it helps us calculate the total sales. We know that the players sold cost us £59.6M and that in previous years we had charged £31.9M of that to the Profit and Loss Account so the remaining “Book Value” of those players when we sold them was the difference between those two, £27.7M. From the Profit and Loss Account we know that we made a profit of £100.5M on those sales so we must have generated £128.2M of transfer fees for those players (£100.5M plus £27.7M).
The figure that we have missed out from the Amortisation section of the note is the charge for the year of £61.7M and this is the Amortisation of all the remaining players in the squad after sales based on the calculation explained earlier, of spreading the cost of buying them over the length of each player’s contract.
So, the summary of transfer activity is that we bought new players at a cost of £140M and sold players for a total of £128M, but the impact on this year’s profit and loss account was £100M of profit on sales offset by £62M of Amortisation, making a net positive impact of £38M. That’s clearly a good year, especially given what we now know about the squad’s relative performance on the pitch compared to last year, but it did rely on a major sale of an academy product so it isn’t easy to replicate in future years.
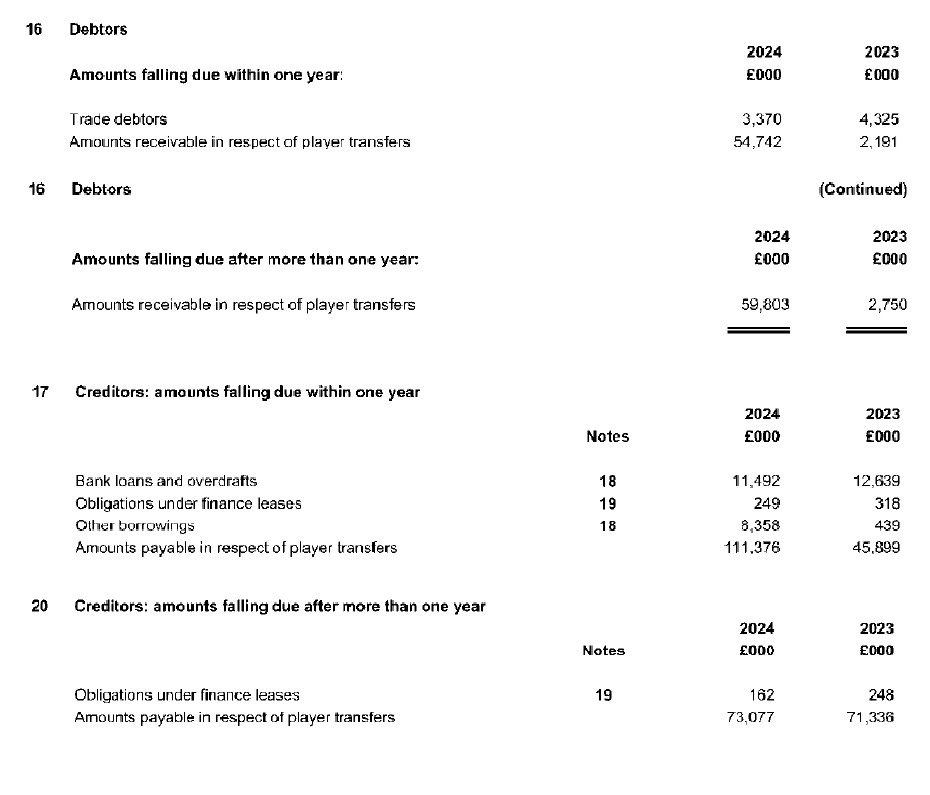
The final section to consider with transfer activity is how much we are owed by other clubs for players they have bought from us and how much we still have to pay for players we have signed. This doesn’t impact Profit and Loss, but it does tell us about our ongoing financial commitments and our need to generate cash. We can see these figures in the Debtors and Creditors notes to the accounts and they tell us that we are owed £114.5M (£54.7M within one year and £59.8M after one year), but we owe £184.5M (£111.4M within one year and £73.1M after one year), so to complete the transfer cycle we will need to find £70M of additional cash.
Debt
Building off that £70M net that Forest owe on their transfer activities to date, it makes sense to look at the overall debt picture as this shows the commitments that the club had at the close of the year. Previously the owner had been putting money in via two sources, the provision of debt financing from his holding company and the conversion of that debt into shares (equity) to effectively write the obligation to the holding company off. At the start of the year the club owed NF Football Investments £23M, but by the end of the year this was converted to shares, along with an additional £59M of in year funding, making a total share issue for the year of £82M.
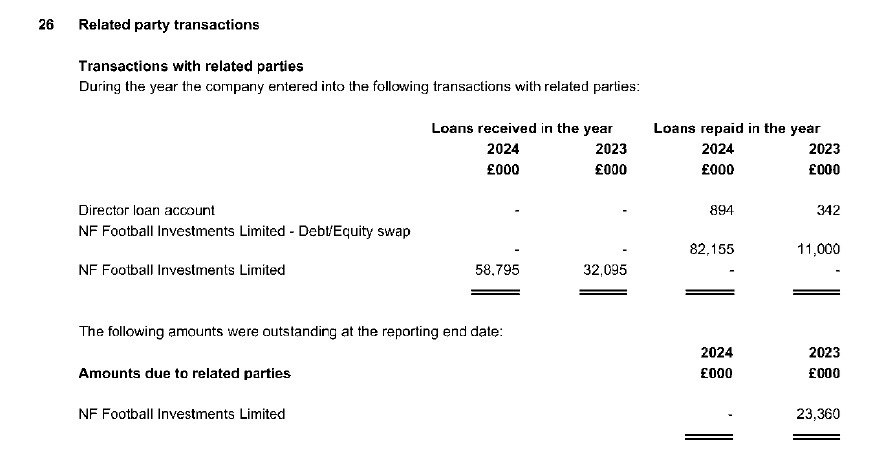
Overall the owner has converted £170M of debt to shares during his 7 years of ownership and as can be seen in Amounts due to related parties above there was no current obligation at the year end.
The club has taken on debt from other external sources though, including a bank overdraft and loans with financing companies, some of which relate to bringing forward the benefit of players sold under staged payment agreements, so that the club releases cash from those deals sooner but pays interest on the amounts brought forward via the finance houses.
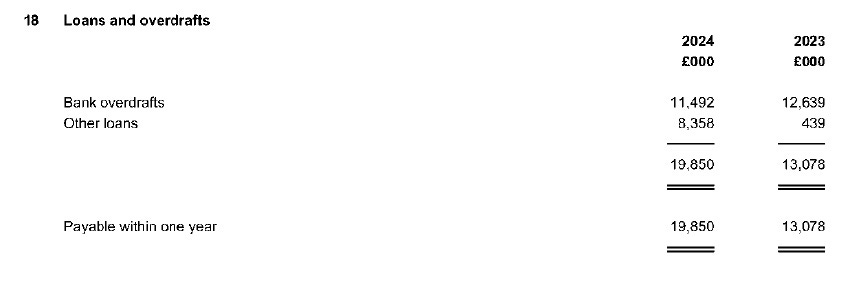
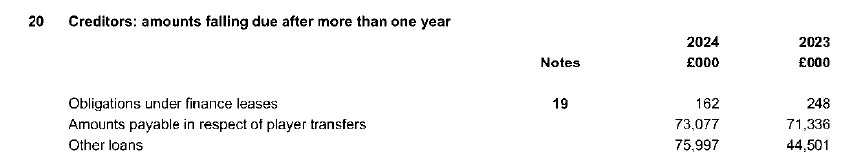
As at the year end, the club had a bank overdraft of £11.5M and loans totalling £84M (made up of £8.4M due within one year and £76M due after one year), making a total net debt position of £95M. Add in the net balance on transfer activities and that makes £165M of obligations outside of normal trading activities.
Final Takeaways
The headlines this year are:
We brought in a record amount of income at almost £190M
We made a pre-tax profit for the first time in around 20 years, £12.1M
Our EBITDA was much improved but still negative at £(10.4)M
We made a profit of £100M on players we sold and that underpins the good news in these accounts
We spent £140M adding new players to the squad
The owner has put a lot of money into the club, issuing £82M of new shares this year, taking his total equity investment to £170M and removing any debt to him through the holding company
Despite that, we have external loans and overdraft of £95M and we owe a net amount of £70M on previous transfer activity
So, what does all this mean in the end? We can walk away with these headlines but beyond that it’s hard to say, because the nature of Premier League football is the significant element of shifting sands. In 2024/25, the current financial year, we could receive an additional £42M of Premier League money due to finishing so much higher in the league, but we haven’t as yet sold any significant players so we won’t see that £100M profit on player sales unless we sell in the early part of the summer transfer window. If we qualify for the Champions’ League we will make more money in 2025/26, but if we also drop down the Premier League table we might have lower income from that competition.
You quickly begin to see why club’s at this level start to panic when football results go badly. Our current upward trajectory means that our income keeps going up. Every place higher in the Premier League is worth £3M, so a rise of 8 or 9 places in the league generates as much income as our entire operation in the Championship. Those figures are incredible, but if you begin to rely on that then a drop in position becomes a problem, to drop out of the league entirely a disaster. Every moment of glory on the pitch is potentially a step closer to a precipice off it, which is a crazy way to run a game. What can we do? Just keep swimming.